 (click for a higher resolution image)
Background

A few months ago I bought a couple of lemon trees to grow in my conservatory, but most excitingly for me, a Buddha’s hand tree. This tree was fairly expensive, and I wanted to maximise it’s chances of surviving and hopefully thriving. Citrus trees are quite sensitive to extremes of temperature (they obviously don’t like cold, but apparently don’t like excess heat either) and also humidity, preferring an atmosphere of around 50% relative humidity or more.
It was for this reason that I decided to start experimenting with climate monitoring.
The Hardware

I was originally planning on making some sensor units as described in Aaron Paterson’s ESP8266 + Plantower AQ sensor project, so I ordered a load of parts and PCBs to make those, but a lot of the parts for these sensor units are ordered from AliExpress, and so have delivery times in the order of weeks to months, rather than days, so given that my Buddha’s Hand tree had already arrived I decided to get some BME280 temperature, humidity and pressure sensors from Amazon as they don’t cost too much and would allow me to get a jump start on checking that my trees were safe.
These BME280 sensors use the I²C bus, which makes them really easy to connect to, and read, from an Arduino or Raspberry Pi. I have both hanging around, but the Raspberry Pi is easier to get something quick running because I can write my code in a higher level language and it comes with Wifi onboard. Using the raspberry pi meant that the equipment list I needed was small.
Required equipment
- Raspberry Pi
- BME280 sensor
- Wire to connect the sensor to the Raspberry pi
- Power supply for the Pi
Wiring the sensor was pretty easy. You can find Raspberry Pi pinout diagrams on the Web, and you just need to connect:
- VIN to DC Power 5v (pin 4)
- GND to Ground (pin 6)
- SCL to SCL1 (pin 5)
- SDA to SDA1 (pin 3)
That’s it! No complex electronics required for this setup.
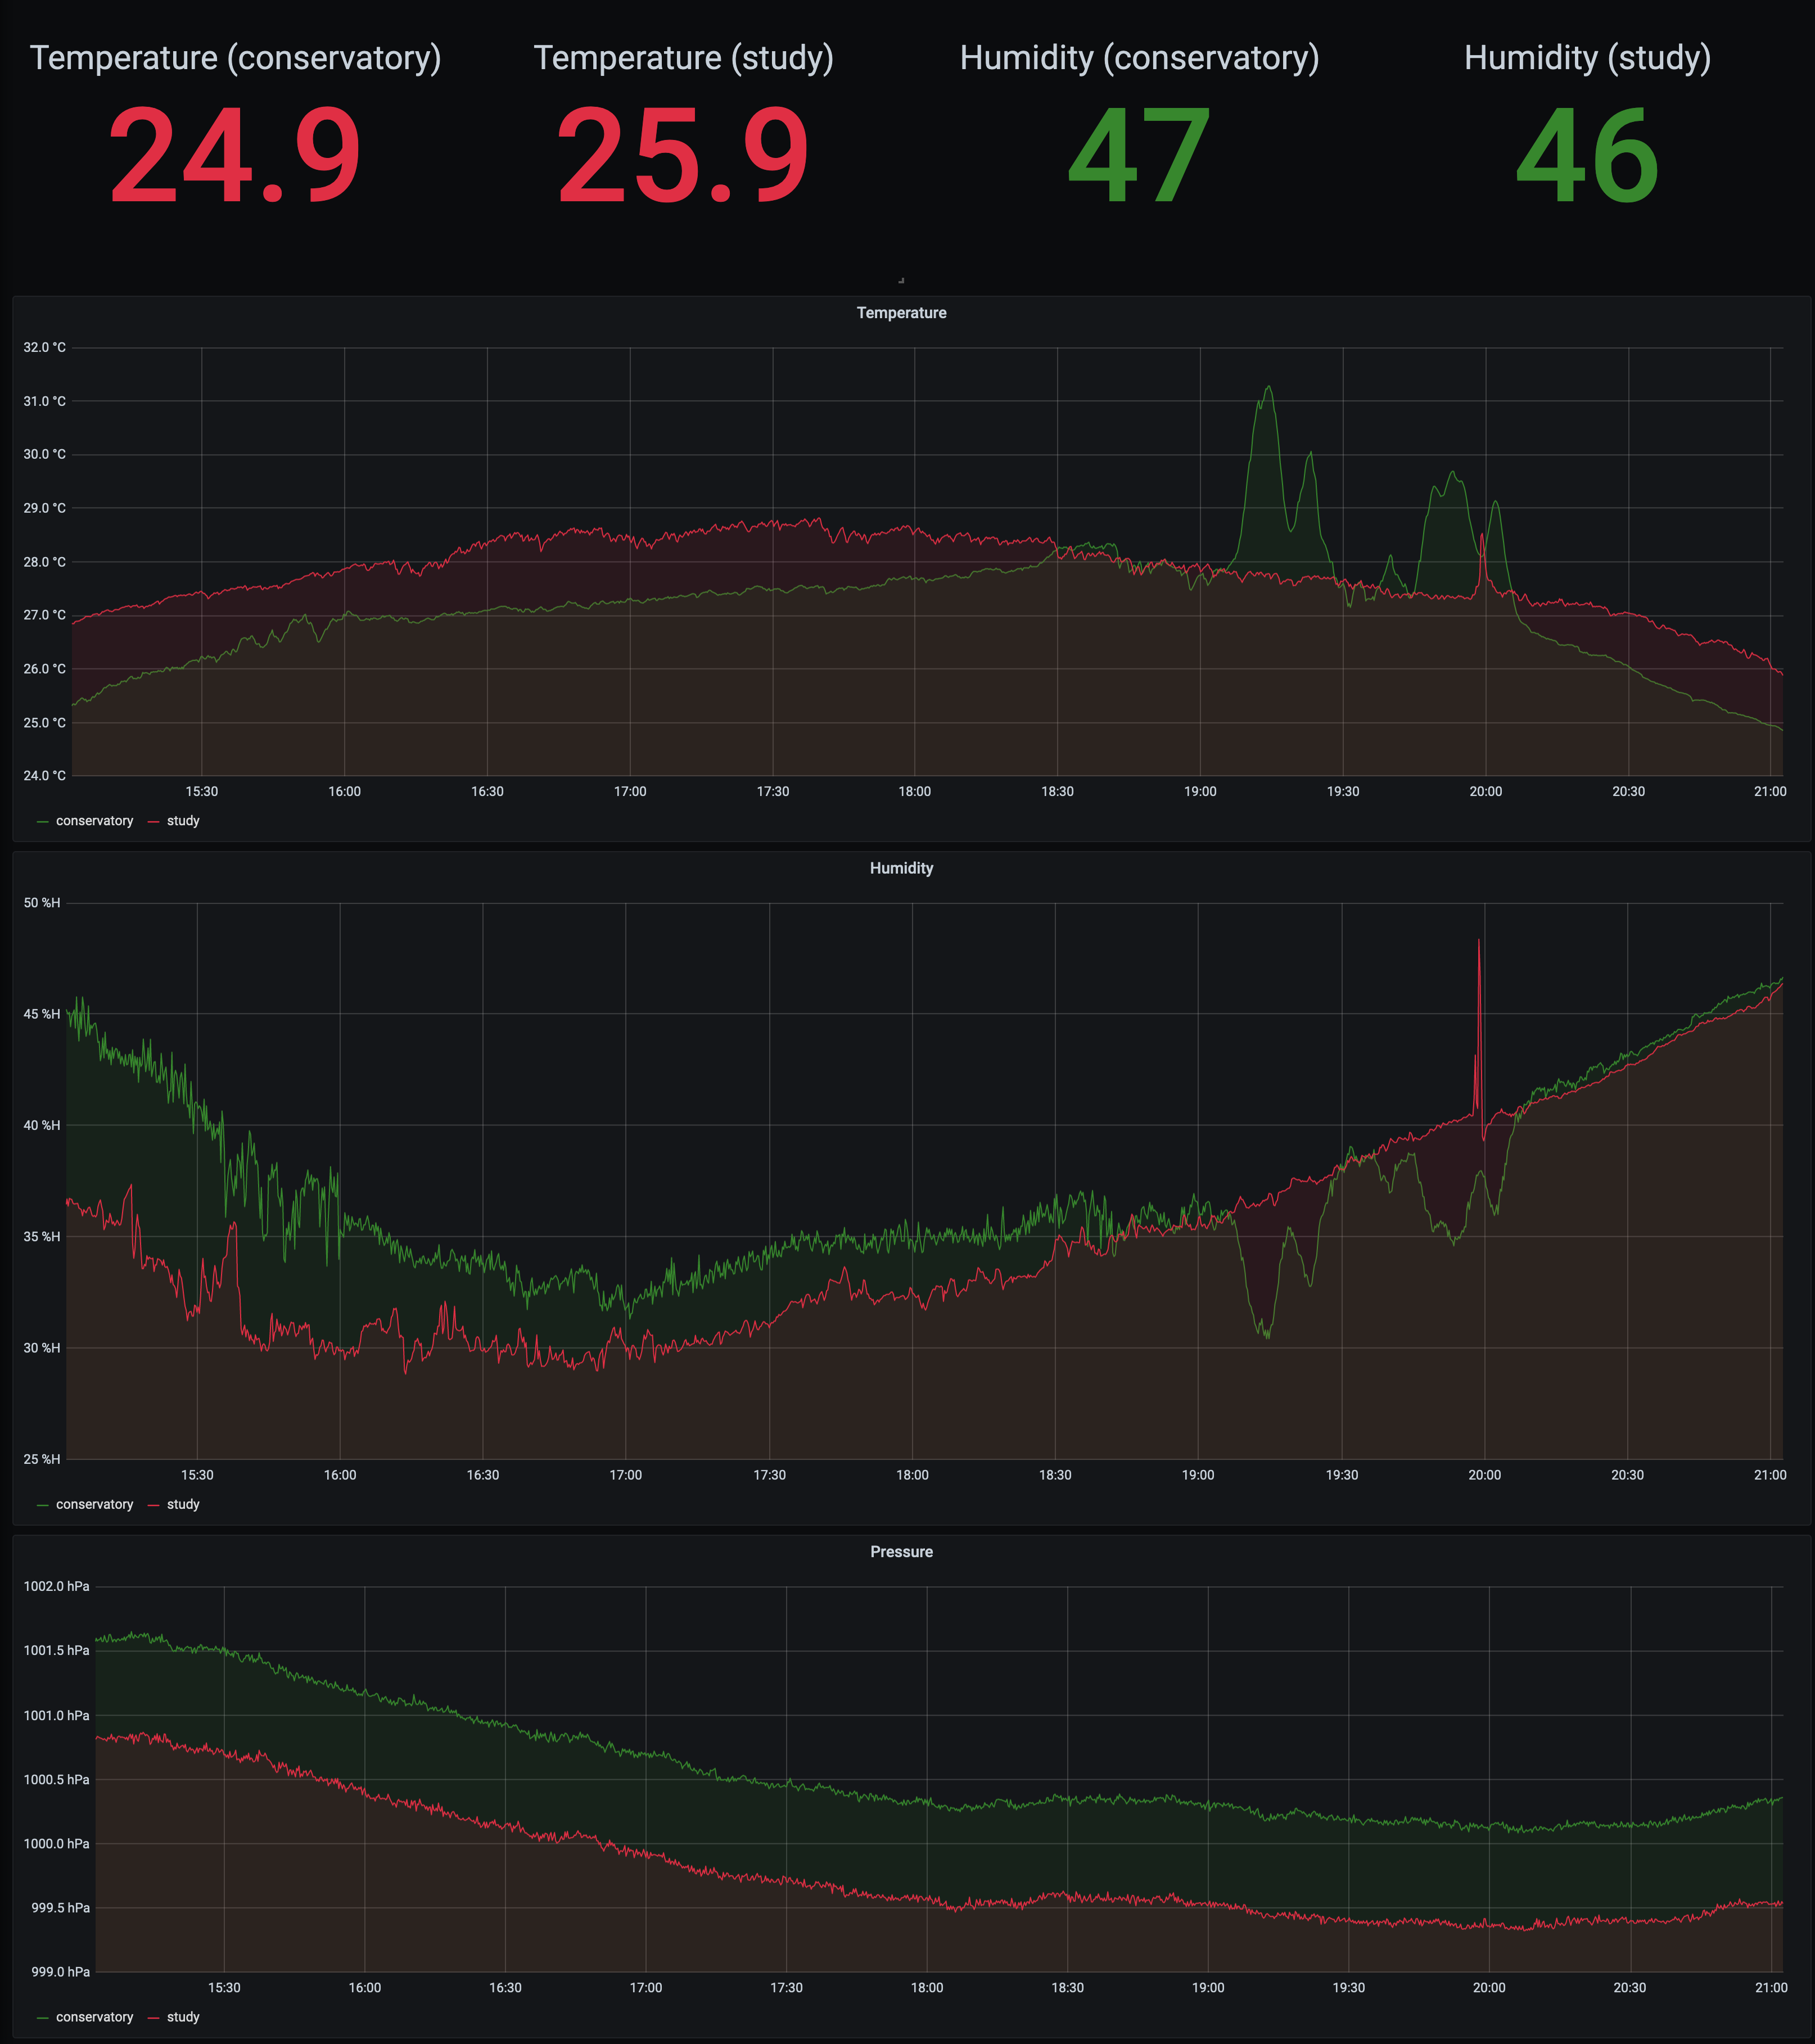
The Software
I decided on using an Influx DB to store the data, and to graph the results in Grafana (as Aaron does for his monitoring) as they seemed like a good fit, and I didn’t want to spend too much time looking at alternatives as my trees were going unmonitored. They are also incredibly easy to connect to each other to see the time-series data in Influx DB in Grafana which helps a lot. There is handily an existing guide to installing Influx DB and Grafana on a Raspbery Pi 4 already available, which made things a bit quicker.
For the software to grab the sensor readings and put the data into Influx I used Go for a number of reasons:
- I like writing it
- It’s efficient. Raspberry Pis are faster than they used to be, but they’re still somewhat constrained
- It’s really easy to deploy to a Pi
- It’s really simple to make work with systemd
In reality you can use whatever language you like, Ruby or Python would be fine as this isn’t a highly CPU or memory intensive application, but you are likely to want to choose a language that someone has already written a driver for the sensor in as that’s going to cut down the amount of time you have to spend writing the software a lot.
It just so happens that a couple of people have written Go libraries for the BME280, I chose this one. Putting it to use it’s fairly simple to get the data out of the sensor and print it to the terminal:
package main

//
// Get sensor data from the BME280 and print it to the terminal
//

import (
	"fmt"
	"log"

	"github.com/maciej/bme280"
	"golang.org/x/exp/io/i2c"
)

func getBME280() *bme280.Driver {
	device, err := i2c.Open(&i2c.Devfs{Dev: "/dev/i2c-1"}, 0x76)
	if err != nil {
		log.Fatal(err)
	}

	driver := bme280.New(device)
	err = driver.InitWith(bme280.ModeForced, bme280.Settings{
		Filter:                  bme280.FilterOff,
		Standby:                 bme280.StandByTime1000ms,
		PressureOversampling:    bme280.Oversampling16x,
		TemperatureOversampling: bme280.Oversampling16x,
		HumidityOversampling:    bme280.Oversampling16x,
	})

	if err != nil {
		log.Fatal(err)
	}

	return driver
}

func main() {
	bme280 := getBME280()
	defer bme280.Close()

	response, err := bme280.Read()
	if err != nil {
		log.Fatal(err)
	}

	fmt.Printf(
		"Temp: %.1fC, Press: %.1fhPa, Hum: %.1f%%\n",
		response.Temperature,
		response.Pressure,
		response.Humidity,
	)
}
To make this code work for yourself, write it to a file, compile it on your local machine:
GOOS=linux GOARCH=arm GOARM=7 go build sensor.go -o sensor
Copy it over to your Raspberry Pi, wherever that happens to be:
$ scp sensor pi@192.168.1.120:~/
tmp 100% 2096KB   4.4MB/s   00:00
Then SSH into your Raspberry Pi and after you have made sure that i2c is enabled run the binary as root:
# sudo ./sensor
Temp: 22.4C, Press: 1000.0hPa, Hum: 54.8%
Sweet! The next step is to get the data into Influx DB so we can log it and graph it with Grafana. To do that I used the Influx DB API provided by the Influx creators themselves. This looks something like this:
package main

import (
	"context"
	"flag"
	"fmt"
	"os"
	"time"

	influxdb2 "github.com/influxdata/influxdb-client-go"
	lcd "github.com/wjessop/lcm1602_lcd"
	"golang.org/x/exp/io/i2c"
)

const (
	databaseName = "climate"
	locationName = "conservatory"
)

func main() {
	// create new client with default option for server url authenticate by token
	client := influxdb2.NewClient(
		fmt.Sprintf("http://127.0.0.1:8086", influxhost),
		"climate-writer:<password goes here>",
	)

	// user blocking write client for writes to desired bucket
	writeAPI := client.WriteApiBlocking("", databaseName)

	var ctx = context.Background()

	now := time.Now()

	// Write a single datapoint to Infux
	p := influxdb2.NewPoint(
		"stat",
		map[string]string{"unit": "temperature", "location": locationName},
		map[string]interface{}{"value": response.Temperature},
		now,
	)

	if err = writeAPI.WritePoint(ctx, p); err != nil {
		log.Fatal(err)
	}

	// Repeat the above Influx write for humidity and pressure
}
I have pushed a full working example including reading the sensor data and sending to Influx DB to Github. It also includes optional writing of the climate data to an LCD panel.
That is pretty much it! Place your Raspberry Pi with it’s sensor in the place you want to be monitored, and it will gather the data for you. Creating a Grafana dashboard is left as an exercise for the reader.
The Finished Device
Here is the working sensor and Pi in place in my conservatory, running the Go program, Influx DB and Grafana. I have now added a second Pi in my study that reports it’s sensor readings to the Influx DB on this machine too.

Improvements
Raspberry Pis are fairly expensive, and have way more processing power than is needed to read sensor data, and they draw more power too. I plan on eventually putting together the boards in Aarons project so I can put a few more of these around my house relatively cheaply, and with more sensor types. The Raspberry Pi is a great stop-gap though, and fine for a one-off. I may still run Influx and Grafana on a Pi.
Because the Raspberry Pi was meant to be temporary I’ve left it bare, I’ll 3d print some cases for everything when my 3d printer arrives.
In my next post I discuss how I added an LCD display to show the climate data.